

Visualization
Streetscapes, Timelines, and 3D
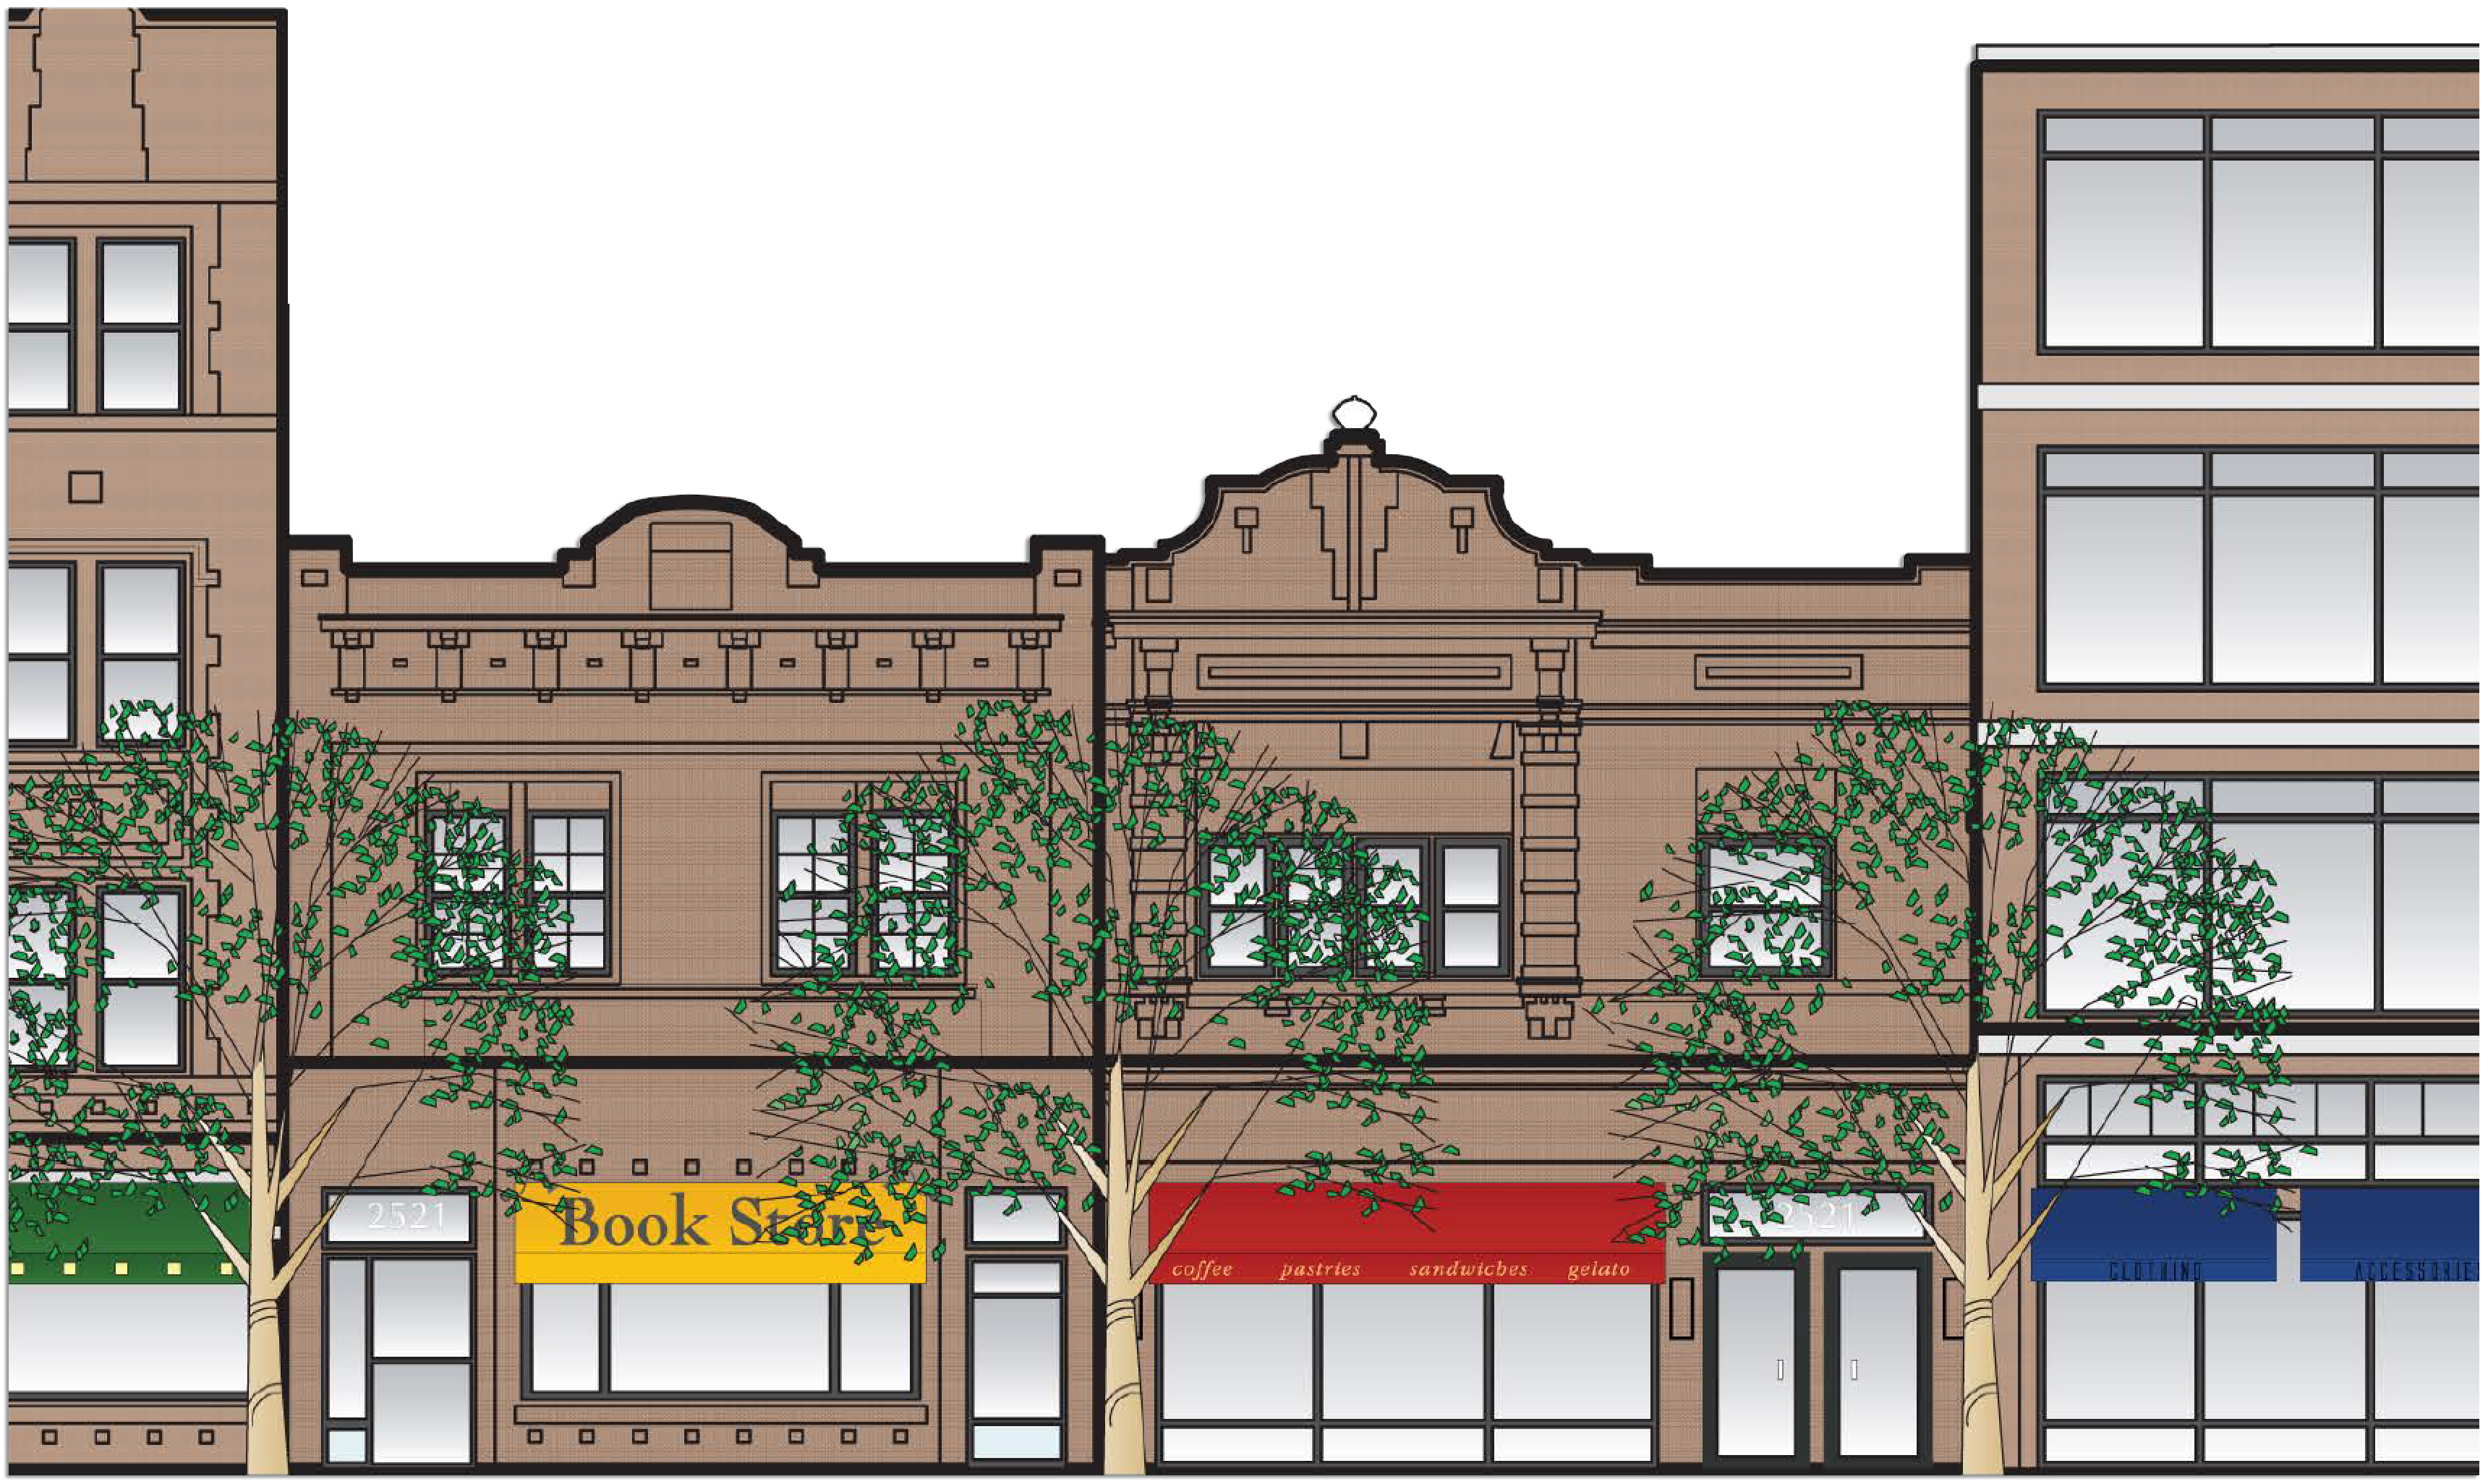
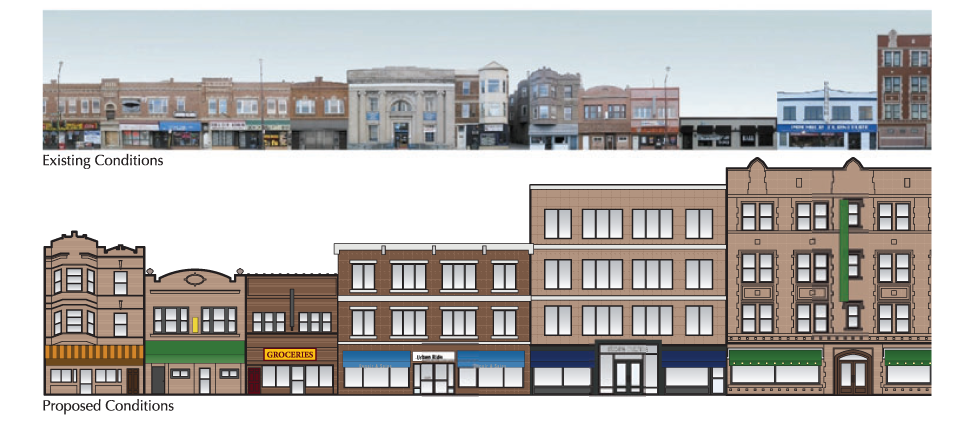
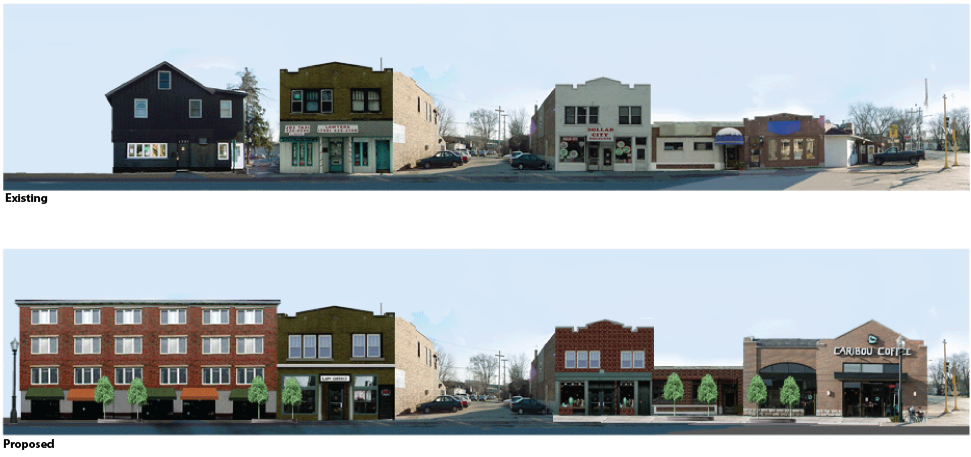
Streetscape improvements and infill can be visualized.
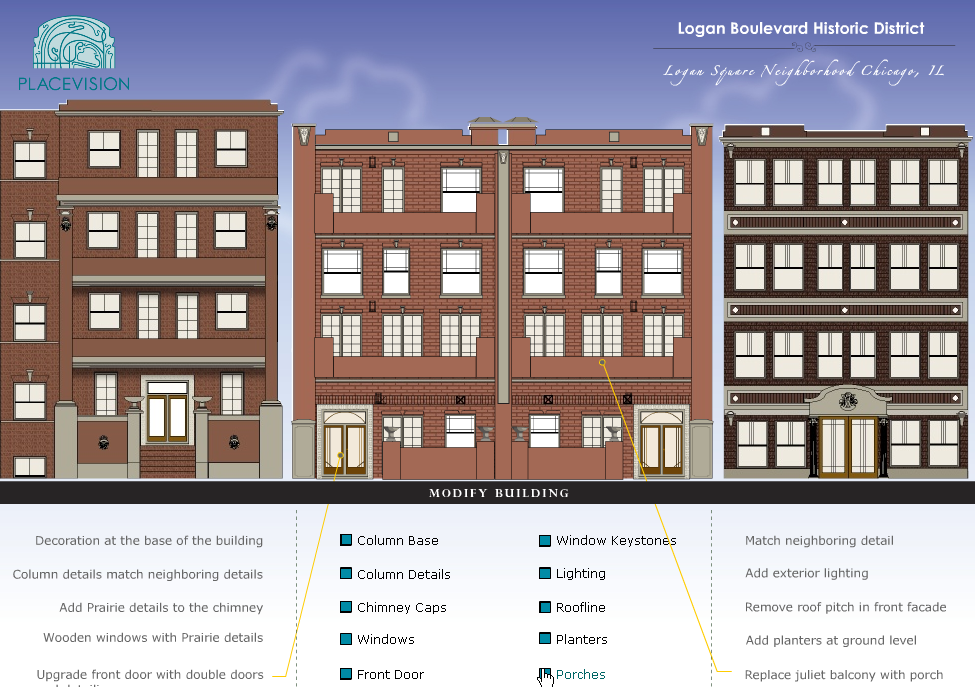
Individual architectural elements can be viewed to blend new development in historic neighborhoods.
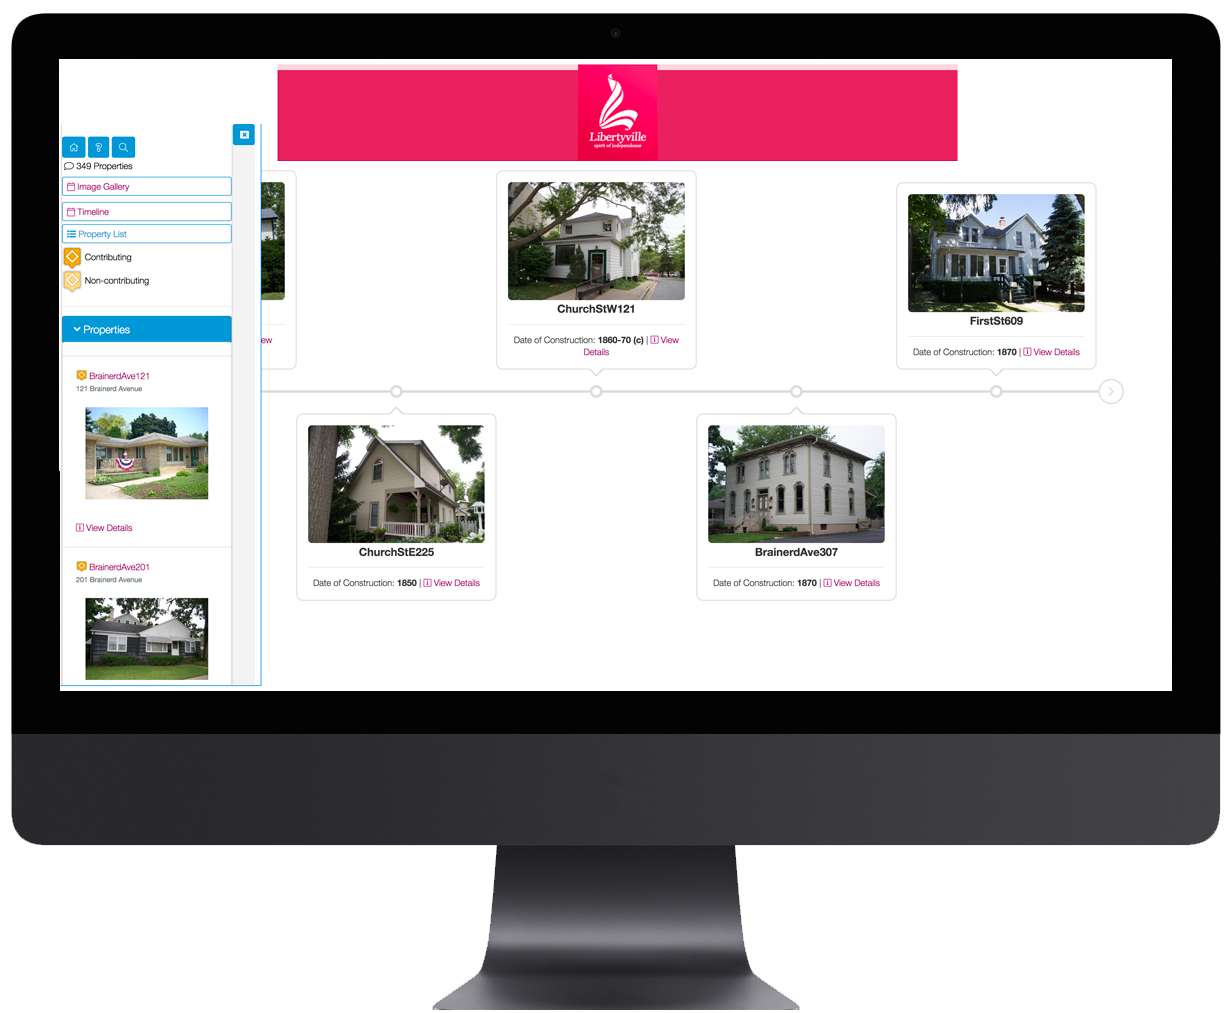
The Village of Libertyville used PlaceVision’s SiteVista software to inventory its district and display properties on a timeline.
Visit the property survey website
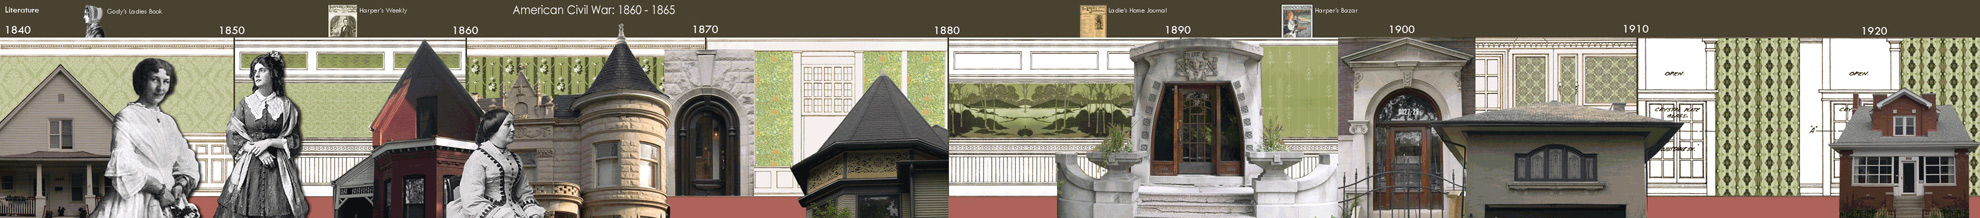
We also create static image timelines to tell stories.
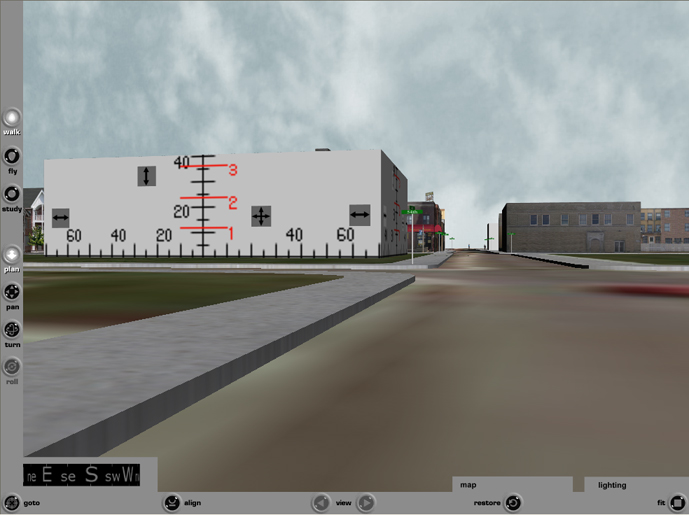
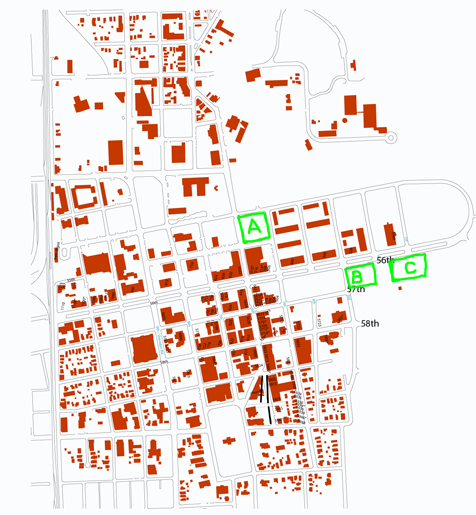
We created a 3D urban form model of downtown Kenosha to help planners visualize development restrictions on key parcels.
The model also shows existing conditions of more than 30 streets.
Individual buildings can be replaced to show future enhancements or development.
“Crystal is an extremely creative person and very capable in a wide range of computer applications. She separates out the unnecessary portions of a job and concentrates on what the job is all about and gets it done in a very high-quality way.”
-Dr. Albert Schorsch III
Associate Dean of the College of Urban Planning
-Dr. Albert Schorsch III
Associate Dean of the College of Urban Planning